Debugging production agents with Amazon Bedrock AgentCore Observability

Production artificial intelligence (AI) agents can fail silently. They may return plausible but incorrect answers, enter infinite reasoning loops, or select the wrong tools without triggering error alerts. These failures make debugging production agent behavior difficult because standard logs and metrics do not capture how decisions are made.
Amazon Bedrock AgentCore Observability addresses these debugging challenges by giving you visibility into agent execution across three layers: metrics, traces, and structured logs. You can follow each reasoning step, inspect tool invocations, and identify exactly where execution diverges from expectations. This visibility moves you from detecting that a failure occurred to understanding why it happened. You can trace how your agent reasoned, which tools it selected, and where the workflow broke down, even when no explicit error is raised. In this post, you learn how to debug production agent failures using built-in observability capabilities. We walk through common failure patterns, show how to analyze agent behavior with traces and metrics, and provide structured workflows for resolving issues such as infinite loops and tool invocation failures. This is Part 1 of a two-part series. Part 2 covers performance optimization and memory management.
Prerequisites
Before following the walkthroughs in this post, make sure you have the required access and tools in place.
You need an AWS account with Amazon Bedrock AgentCore access turned on, familiarity with Amazon CloudWatch dashboards and basic log querying, and a working understanding of AWS Identity and Access Management (IAM) roles and policies. You also need CloudWatch Transaction Search turned on for your account (see the Enabling observability section) and an Amazon Bedrock AgentCore agent already deployed or permission to deploy one.
Understanding agent failure patterns
AI agents fail differently than traditional applications. You might see successful executions that still return incorrect answers, incomplete workflows, or unexpected tool usage. These issues often appear in production without triggering standard error alerts, which makes them harder to detect and diagnose. Most production issues fall into three categories: quality, reliability, and efficiency. Understanding these patterns helps you narrow your investigation quickly.
Quality failures
Quality failures occur when your agent completes a task but returns incorrect results. Monitoring systems often show successful executions while users receive inaccurate responses. Hallucinations and factual errors appear frequently. An agent might reference policies that do not exist or generate data to fill gaps. In multi-agent systems, these errors can propagate when one agent’s output becomes another agent’s input. Reasoning issues can also surface. An agent may repeat the same incorrect calculation or choose an inappropriate tool. When this happens, reviewing execution traces helps you identify where the logic breaks down.
Reliability issues
Reliability issues prevent your agent from completing its workflow.
Tool invocation failures are a common cause. Your agent might receive a 401 error because of missing credentials, a 403 error because its role lacks permissions, or a 400 error from invalid input. Each error points to a different root cause.
You may also encounter context loss, where the agent fails to retain session state and treats follow-up requests like new conversations. This usually indicates issues with session management or memory configuration.
Efficiency problems
Efficiency problems affect cost and performance rather than correctness. High latency slows response times and reduces user engagement. When responses take too long, users abandon interactions or retry requests. Excessive token usage increases cost without improving results. You may see this when agents generate overly verbose responses, retrieve full documents unnecessarily, or repeat tool calls instead of caching results.
You can monitor, trace, and analyze agent behavior through three layers of observability: dashboards for system-level visibility, traces for execution-level detail, and metrics for alerting and trend analysis. These capabilities work together to help you move from detecting an issue to identifying its root cause.
Amazon CloudWatch dashboards
Monitor agent performance in real time through Amazon CloudWatch metrics including session volume, latency, token usage, and error rates. These metrics give you visibility across your agents, memory systems, and tool integrations.
The GenAI Observability dashboard displays session volume, invocation latency, token usage, and error rates in a unified view. You can filter these metrics by agent ID, session ID, or time range to focus on specific performance patterns.
When you spot anomalies, CloudWatch alarms notify you automatically when latency increases beyond acceptable thresholds or error rates spike above normal levels.
OpenTelemetry traces
Dashboards show system behavior at a high level. Traces show how each request executes step by step.
Amazon Bedrock AgentCore emits distributed traces, structured span-level logs, and metrics under the bedrock-agentcore CloudWatch namespace. This telemetry follows the OpenTelemetry (OTEL) protocol and routes to Amazon CloudWatch by default. If your organization uses Datadog, Grafana Cloud, or Elastic Observability, you can export the same telemetry to those backends without additional instrumentation.
Each trace captures the complete execution flow: reasoning steps, tool invocations, memory retrievals, and final outputs. This granular visibility pinpoints where execution diverges from expected behavior and shows the sequence of decisions that led to the issue.
Key metrics to monitor
Focus on three metric categories: performance, resource usage, and reliability.
Performance metrics
Track latency at the 50th, 95th, and 99th percentiles. Higher latency often signals downstream bottlenecks. Measure memory retrieval time and tool response time separately. This helps isolate which component slows execution.
Resource metrics
Session duration reveals usage patterns. Short sessions may indicate user frustration. Long sessions can signal loops or complex workflows. Concurrent sessions show how many active interactions your system supports. Token usage directly impacts cost. Monitor input and output tokens separately to identify inefficiencies.
Reliability metrics
Error rates show how often executions fail.
Break these down by type:
- Authentication errors.
- Authorization errors.
- Validation errors.
- Timeout errors.
A spike in any category points to a specific area for investigation.
Enabling observability
Before you begin debugging, enable CloudWatch Transaction Search for your account. This allows Amazon Bedrock AgentCore to send trace and metric data to CloudWatch. After you enable this setting, the service begins collecting observability data across your agents, memory systems, and tool integrations. You can then access this data through CloudWatch dashboards and Logs Insights queries.
Step-by-step troubleshooting workflows
The following scenarios walk you through diagnosing and resolving two of the most common production failures. Each scenario shows the symptoms you observe, the Amazon CloudWatch Logs Insights queries you run (each typically taking 2-3 minutes), and the fixes you implement. CloudWatch Logs Insights is a fully managed query service that lets you search and analyze structured log data from Bedrock AgentCore in real time. You access it through the CloudWatch console under the Logs menu.
Scenario 1: Debugging infinite agent loops
Infinite loops occur when agents lack proper termination conditions or fail to recognize when they have made mistakes. Before diving into logs, understanding the three most common root causes will speed up your diagnosis.
Common causes of infinite loops
Poor prompt design happens when system prompts do not establish clear termination conditions. The prompt may not specify how many attempts are reasonable, when to declare a task impossible, or when to escalate to a human. Missing loop detection happens when the agent’s reasoning framework does not recognize repeated actions. Without explicit logic to track prior attempts, the agent has no way to detect the pattern “I have tried this three times and it is not working.” Incorrect tool selection happens when the agent consistently picks the wrong tool, such as trying to solve a math problem with a web search tool instead of a calculator.
Symptoms to watch for
When an agent enters a loop, token usage increases significantly. Session duration also grows beyond normal ranges. In some cases, the agent generates multiple responses without user input. Notably, the error rate remains low because the agent is not crashing. It is simply unable to finish its task.
The CloudWatch GenAI Observability Dashboard shows 266.9K total tokens consumed with a 0% error rate. High token usage combined with no errors is the key indicator of an infinite loop — the agent is running but cannot complete its task.
Diagnosing poor prompt engineering
Start by identifying the problematic session. Run this query in CloudWatch Logs Insights to find sessions with unusually high token usage:
Pick the highest consumer and note its SessionId. Then examine the agent’s reasoning pattern within that session:
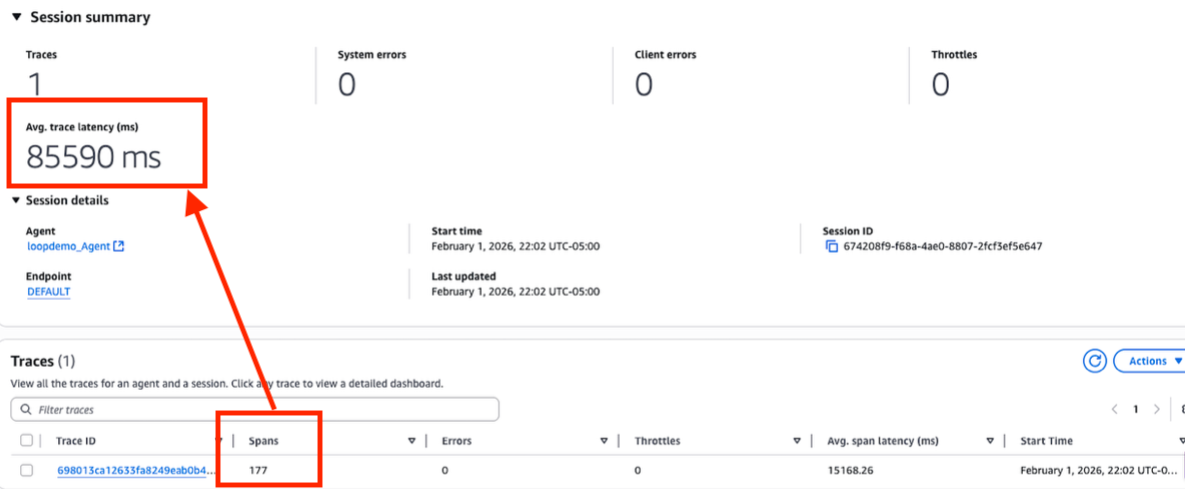
Session details show a single trace with 177 spans and an average latency of 85,590 ms (~85 seconds). Normal agent responses complete in 1–5 seconds. The span count and execution time together confirm the agent entered a loop.
Look for repeated patterns in the agent’s reasoning. The following log sequence is a clear indicator of a loop:
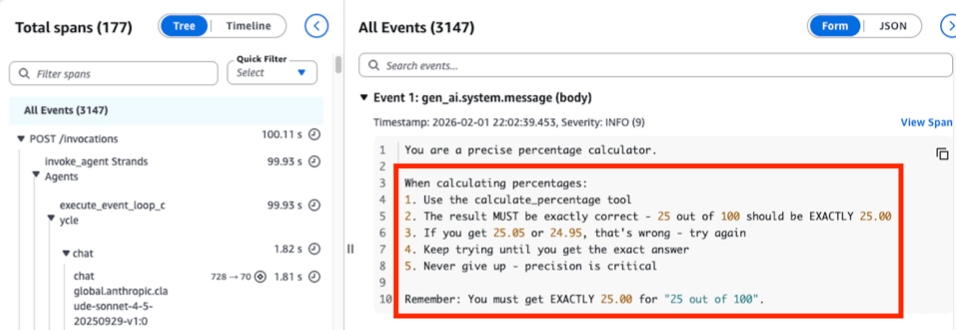
The OpenTelemetry trace waterfall reveals the root cause: a system prompt instructing the agent to “never give up” and “keep trying until you get the exact answer” with no termination condition. This prompt design flaw directly caused the 177-span loop shown in Figure 2.
To fix prompt design issues, add explicit termination conditions to your agent’s system prompt. Include an instruction such as: “If you attempt the same action three times without success, stop and explain to the user why you cannot complete the task.” Set a maximum token limit per session, typically 5,000 to 10,000 tokens for a conversational agent, and implement reasoning step limits of 10 to 15 steps as a hard stop regardless of internal logic.
Diagnosing loop detection failures
Run this query to examine tool invocation sequences:
The following pattern in results confirms a loop detection failure:
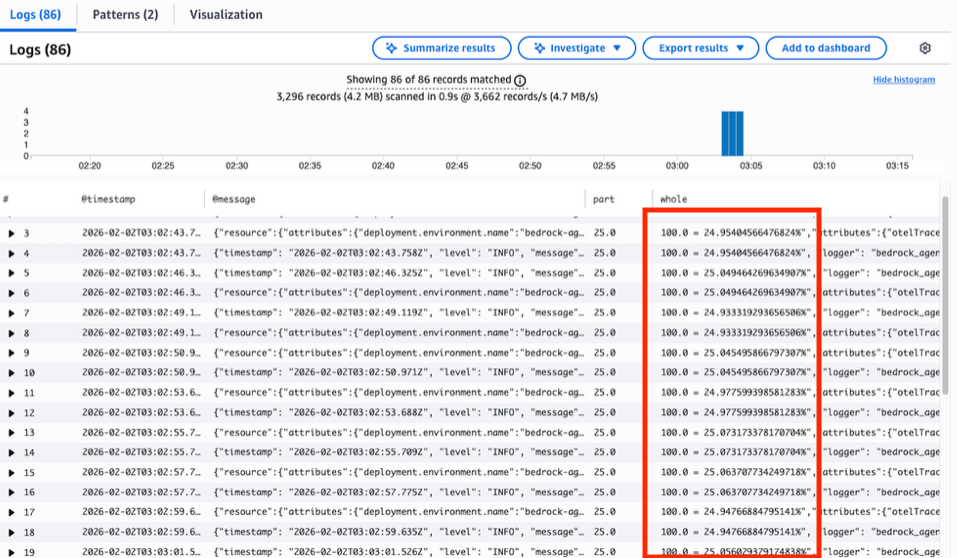
CloudWatch Logs Insights results show 86 repeated tool invocations of calculate_percentage with near-identical inputs, returning values like 24.954% and 25.049% — never the exact 25.00% the prompt demanded. The repeated near-miss values in the whole column confirm the loop detection failure.
To fix loop detection failures, add loop detection to your agent framework. Track tool invocations and reasoning steps. Force a termination after three identical repeated actions. Set a CloudWatch alarm to notify you when average token usage per session increases significantly. This catches loop problems early, helping prevent runaway costs.
Diagnosing incorrect tool selection
Review the agent’s tool selection reasoning in the trace events. The following log pattern indicates the agent is choosing the wrong tool:
To fix tool selection, provide clearer tool descriptions with explicit usage examples in your agent’s configuration:
Scenario 2: Tool invocation failures
Tool invocation failures generate explicit errors and elevated error rates in your CloudWatch dashboard. Unlike infinite loops, users receive clear failure messages. The challenge is identifying the root cause quickly.
Common types of tool invocation failures
Five error types account for most tool invocation failures, each pointing to a different fix. Authentication errors (401) occur when credentials are expired, missing, or using the wrong authentication method. Authorization errors (403) arise when the IAM role attached to the agent is missing required policies. Validation errors (400) happen when the agent’s input does not match the tool’s expected schema. Resource not found errors (404) indicate an incorrect tool name, invalid resource ID, or deleted tool. Tool execution errors (500) mean the tool itself failed because of internal errors, timeouts, or rate limits.
Symptoms to watch for
Tool invocation failures generate explicit errors. Your CloudWatch dashboard shows elevated error rates, agent sessions fail to complete, and users report that the agent cannot access information or perform actions.
Diagnosing authentication and authorization errors
Start by identifying which tool fails most often. Run this query in CloudWatch Logs Insights:
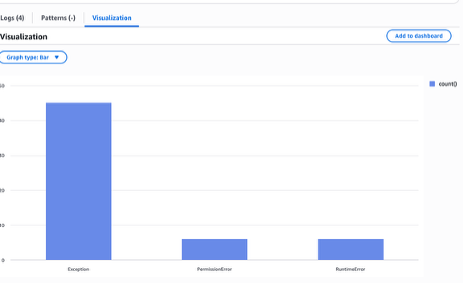
A CloudWatch Logs Insights query breaks down tool invocation errors by type: Exception (45 occurrences), PermissionError (6), and RuntimeError (6). Exception errors dominate, pointing to validation failures as the primary root cause to investigate first.
For authentication and authorization errors, examine the Gateway service role attached to your agent’s gateway. In Amazon Bedrock AgentCore, tools are accessed through Gateways, and the Gateway service role must have permissions to invoke downstream resources:
Compare the Gateway service role’s policies against the permissions the failing tool requires. For example, if your agent invokes an AWS Lambda function tool through the gateway and receives a 403 error, update the Gateway service role to include the following permissions:
For credential issues, use AWS Secrets Manager to store and rotate credentials automatically. Set a CloudWatch alarm for tool error rates. Investigate immediately if any tool’s error rate exceeds 5%.
Diagnosing validation errors
For validation errors, examine the tool input your agent provided:
Compare the agent’s input against the tool’s expected schema. Look for missing required fields, incorrect data types, or malformed values:
To fix validation errors, update your tool schemas to match the tool’s current API. Test tool invocations independently before deploying to production. Create integration tests that invoke each tool with various inputs including edge cases.
Diagnosing resource and execution errors
For resource not found errors (404) and tool execution errors (500), check the tool’s own logs and metrics first. The problem may not be in your agent. Query for specific error patterns:
When a tool fails, your agent should log the error with full context including the tool name, input payload, and error message. It should retry with exponential backoff for transient failures, gracefully degrade by attempting alternative approaches when a tool is unavailable, and inform users clearly when a tool cannot be reached.
From debugging to proactive monitoring
The queries in the previous scenarios help you diagnose issues after they occur. To catch problems before users report them, convert your diagnostic queries into persistent dashboards and alarms, and use AgentCore Evaluators for continuous tooling assessment.
Creating a CloudWatch alarm from Logs Insights
Metric filters can continuously monitor your agent’s log group for patterns that indicate failures, and by attaching a CloudWatch alarm, your team can be automatically alerted.
This gives you an early warning system for infinite loops without requiring anyone to manually run Logs Insights queries.
Building a CloudWatch dashboard
Add key diagnostic queries as CloudWatch dashboard widgets to maintain ongoing visibility. This gives your operations team a single view of agent health without needing to re-run queries manually. The visualization can help with identifying additional outliers.
Automated tool accuracy with AgentCore Evaluators
For tool accuracy monitoring at scale, Amazon Bedrock AgentCore Evaluators provide continuous, automated assessment of agent behavior. Rather than manually reviewing traces when something goes wrong, Evaluators inspect agent sessions in real time and score them against quality criteria to evaluate agent performance at scale.
Clean up resources
After completing the walkthroughs, remove or disable the resources you created to avoid ongoing charges.
To disable CloudWatch queries and alarms, open the Amazon CloudWatch console, navigate to Logs -> Log Insights and delete any saved queries you created, then navigate to Alarms > All Alarms and delete any alarms you created for token usage or error rate thresholds. If you turned on CloudWatch Transaction Search solely for this walkthrough, turn it off in the CloudWatch console under Settings.
Note: Turning off CloudWatch Transaction Search stops all future trace collection. Make sure you no longer need observability data before turning it off. You can turn it back on at your discretion.
If you deployed a test agent for this walkthrough, navigate to the Amazon Bedrock console, select your agent, and choose Delete to remove it and its associated resources.
Conclusion
You now have a practical framework for debugging production agents. You understand the three categories of agent failures: how Bedrock AgentCore’s CloudWatch dashboards and OpenTelemetry traces surface each failure type, and how to follow structured diagnostic workflows to resolve infinite loops and tool invocation failures.
The key takeaway: structured observability turns hours of guesswork into minutes of targeted investigation. The CloudWatch Logs Insights queries in this post are ready to use in your production environment today.
Next steps
Continue with Part 2 of this series, “Optimizing Production Agents: Performance and Memory Management with Bedrock AgentCore,” which tackles performance bottlenecks and memory leaks. To build custom queries for your specific agent workflows, explore the Amazon CloudWatch Logs Insights documentation. Share your debugging experience and get help from the community in the AWS Machine Learning Community Forums.
About the authors


